Master Your Budget with the Cost Analysis Pareto Chart
As a business owner or creative professional, you likely face a constant barrage of expenses. From software subscriptions and marketing costs to raw materials and freelance fees, it’s easy to feel overwhelmed by where your money is going. The challenge isn’t just tracking these costs—it’s understanding which ones truly matter. This is where the Cost Analysis with Pareto Chart becomes an indispensable tool. It’s not just another spreadsheet; it’s a strategic framework built on the 80/20 rule, designed to bring clarity to your financial chaos and empower you to make smarter, data-driven decisions.
What Exactly is a Pareto Chart and Why Does It Matter?
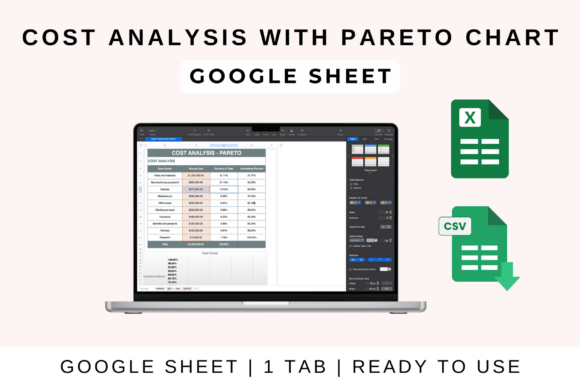
At its core, a Pareto Chart is a visual tool that combines a bar graph and a line graph. The bars represent individual cost factors, ordered from the highest to the lowest expense. The line shows the cumulative percentage, helping you instantly see which categories account for the largest portion of your total costs. This visualization is powerful because it immediately highlights your top cost drivers. Often, you’ll find that roughly 20% of your expense categories are responsible for about 80% of your total spending. Identifying these key areas is the first step toward effective budget management.
The Cost Analysis with Pareto Chart Template automates this entire process. You simply input your data—income and expenses across different categories—and the template does the heavy lifting. It calculates totals, generates the Pareto chart, and uses visual indicators to draw your attention to the most impactful areas. This eliminates guesswork and complex manual calculations, allowing you to focus on analysis and action rather than data entry.
Practical Applications for Entrepreneurs and Creatives
Imagine you run a small e-commerce business. Your expenses might include product sourcing, packaging, shipping, website hosting, social media advertising, and payment processing fees. By using this template, you can quickly see if shipping costs are consuming a disproportionate amount of your budget compared to other areas. Perhaps your advertising spend is high but not generating a proportional return. The Pareto chart makes these relationships visible, helping you decide where to negotiate better rates, cut back, or reallocate funds for better ROI.
For freelancers and service-based professionals, such as designers or marketers, the tool is equally valuable. You can track project-related expenses, software subscriptions, and business development costs. The visual output helps you understand if certain client projects are more costly to deliver than others, or if specific tools are eating into your profits. This insight is crucial for pricing your services accurately and ensuring your business remains sustainable.
Key Features That Drive Real Value
The strength of this template lies in its blend of automation and flexibility. It’s designed to be a practical design asset for your business operations. Here’s what makes it stand out:
- Automated Pareto Chart Generation: No need to manually create charts. The template builds it for you as you enter data, providing an instant visual analysis.
- Built-in Formulas and Visual Indicators: Totals, profit, and loss are calculated automatically. Color coding or other indicators likely highlight top cost drivers, making the sheet intuitive to read at a glance.
- Full Compatibility: Whether you use Google Sheets, Microsoft Excel, or Apple Numbers, the template works seamlessly. This cross-platform functionality is essential for teams or individuals who use different software.
- Customizable Framework: While the structure is professional and ready-to-use, you can easily adjust categories, formulas, and visuals to match your specific business model or project needs.
Integrating Cost Analysis into Your Workflow
Using this tool effectively is straightforward. In Google Sheets, you simply upload the file, open it, and start entering your data under the pre-defined categories. The sheet’s automated calculations will update totals and the Pareto chart in real-time. You can then customize categories—like separating “Digital Marketing” into “Social Ads” and “Content Creation”—to get more granular insights. Sharing the sheet with your team or accountant is also simple, enabling collaborative financial planning.
For Excel users, the process is similar. After downloading and enabling editing, you input your financial data. The formulas work dynamically, allowing you to analyze the insights as they emerge. This hands-on approach helps you engage with your financial data actively, rather than passively reviewing a static report at the end of the month.
Making Smarter Financial Decisions
The ultimate goal of using the Cost Analysis with Pareto Chart is to move from reactive spending to proactive financial management. By clearly identifying your top cost drivers, you can ask targeted questions: Are these expenses necessary? Can they be reduced? Is the investment yielding the expected value? This analysis can inform everything from brand identity investments to operational efficiency.
For instance, if you discover that a significant portion of your budget goes to a premium font or software suite, you can evaluate its direct impact on your logo design, web design, or packaging design. Is it enhancing your professional image and client perception enough to justify the cost? Conversely, if a critical area like customer acquisition costs is high, you might explore more cost-effective marketing strategies. The Pareto chart provides the evidence needed to have these conversations and make confident adjustments.
In a world where every dollar counts, having a clear, visual, and automated system for cost analysis isn’t a luxury—it’s a necessity. This template offers a practical, no-nonsense way to gain control over your finances, ensure your spending aligns with your strategic goals, and ultimately, build a more resilient and profitable business. It’s a foundational tool for anyone serious about sustainable growth and intelligent budgeting.